Basic Configuration
This guide covers the basic configuration of a 2D trend and the various properties which are necessary for its configuration. For more advanced implementation, please reference the provided property documentation and other user guides.
The primary properties which are required for a chart to display data are: data, axes, and pens. These properties are covered throughout this guide and are used as the building blocks for all chart development.
Chart Variants
After installing the SC Charts module, multiple chart variants are provided in the Ignition designer perspective component palette as described by the image below.
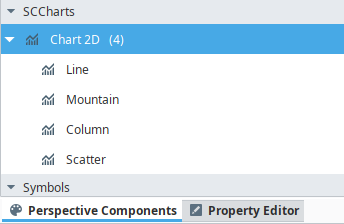
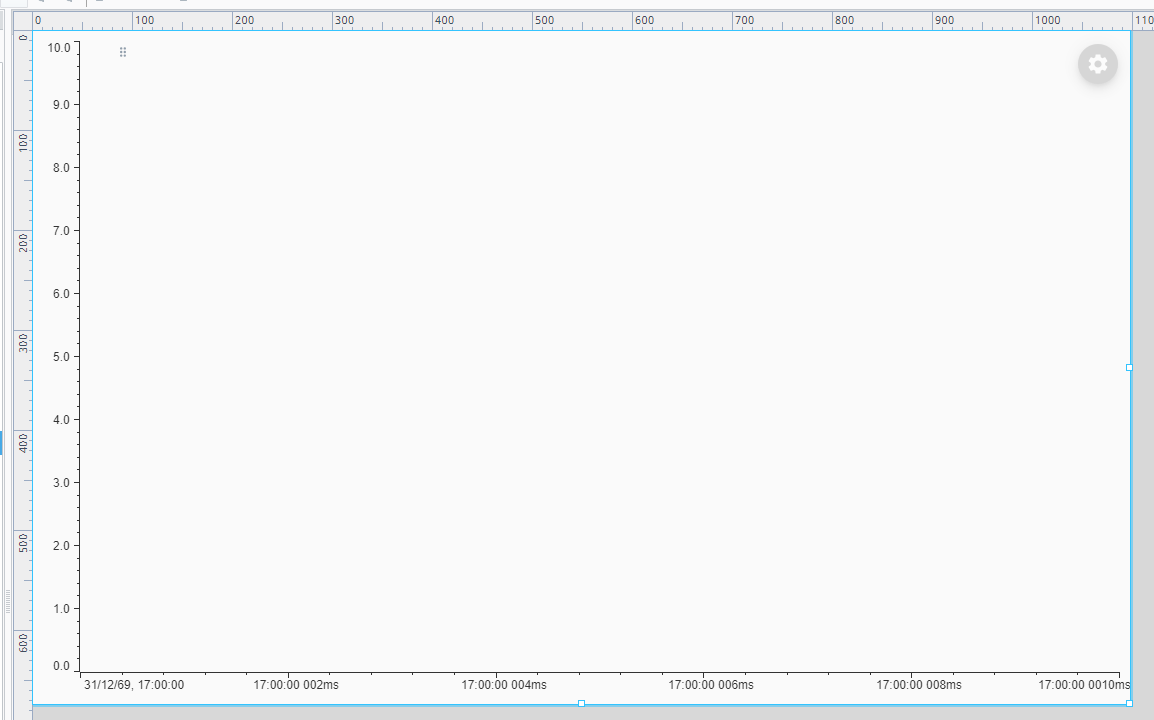
Each variant, similar to the timeseries chart component variants, provide some basic configuration for specific chart types. This guide utilizes the basic Chart 2D variant as its base. Once the basic variant is placed in the designer view, the chart should resemble the following example:
Data
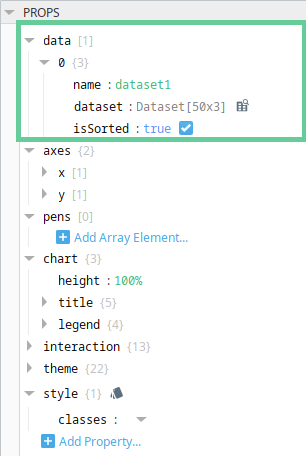
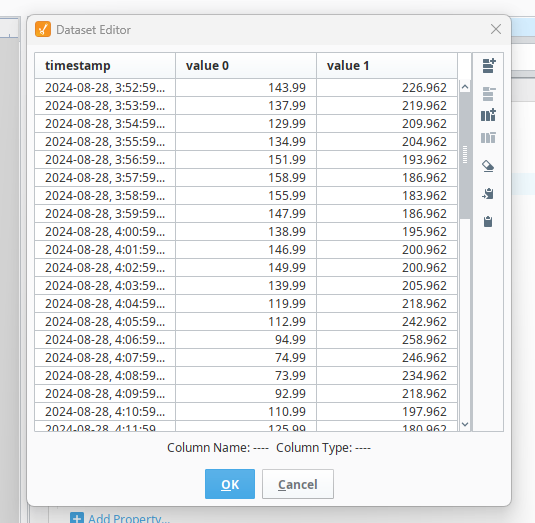
Data is defined under the data property. The data object must include a unique name, a dataset, and must set a flag for whether or not the dataset is sorted in the x-direction. The method in which the dataset property is defined is developer dependant. For this guide, the dataset has been hardcoded but may be bound using property bindings or written to using other scripting methods. See the images below and note the naming of each of your dataset columns as they are used throughout this guide.
Pens
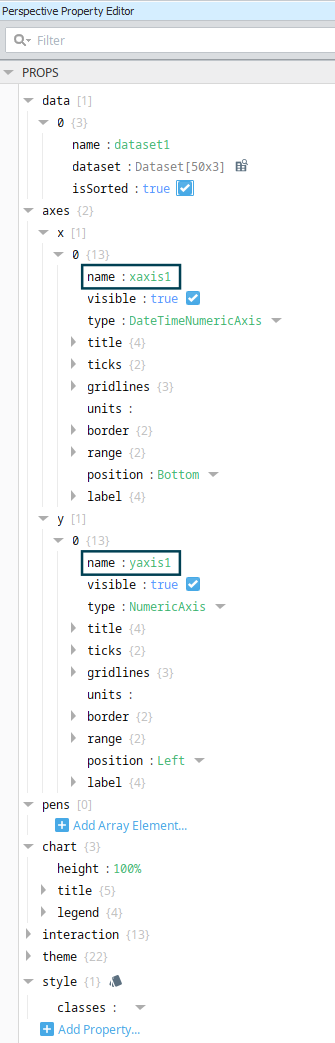
Axes