User Interaction and Control Properties
Interaction
Object containing properties for various interactions and interaction modes
| Name |
Description |
Property Type |
| mode |
Determines chart functionality |
Mode |
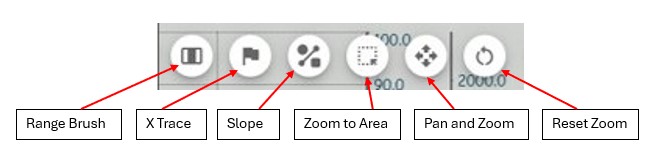
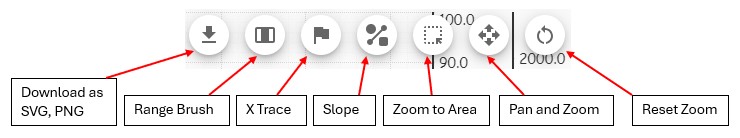
| panZoom |
Enables click-and-drag panning as well as pinch-zooming |
Pan and Zoom |
| slope |
Allows the user to draw lines and view their slope |
Slope |
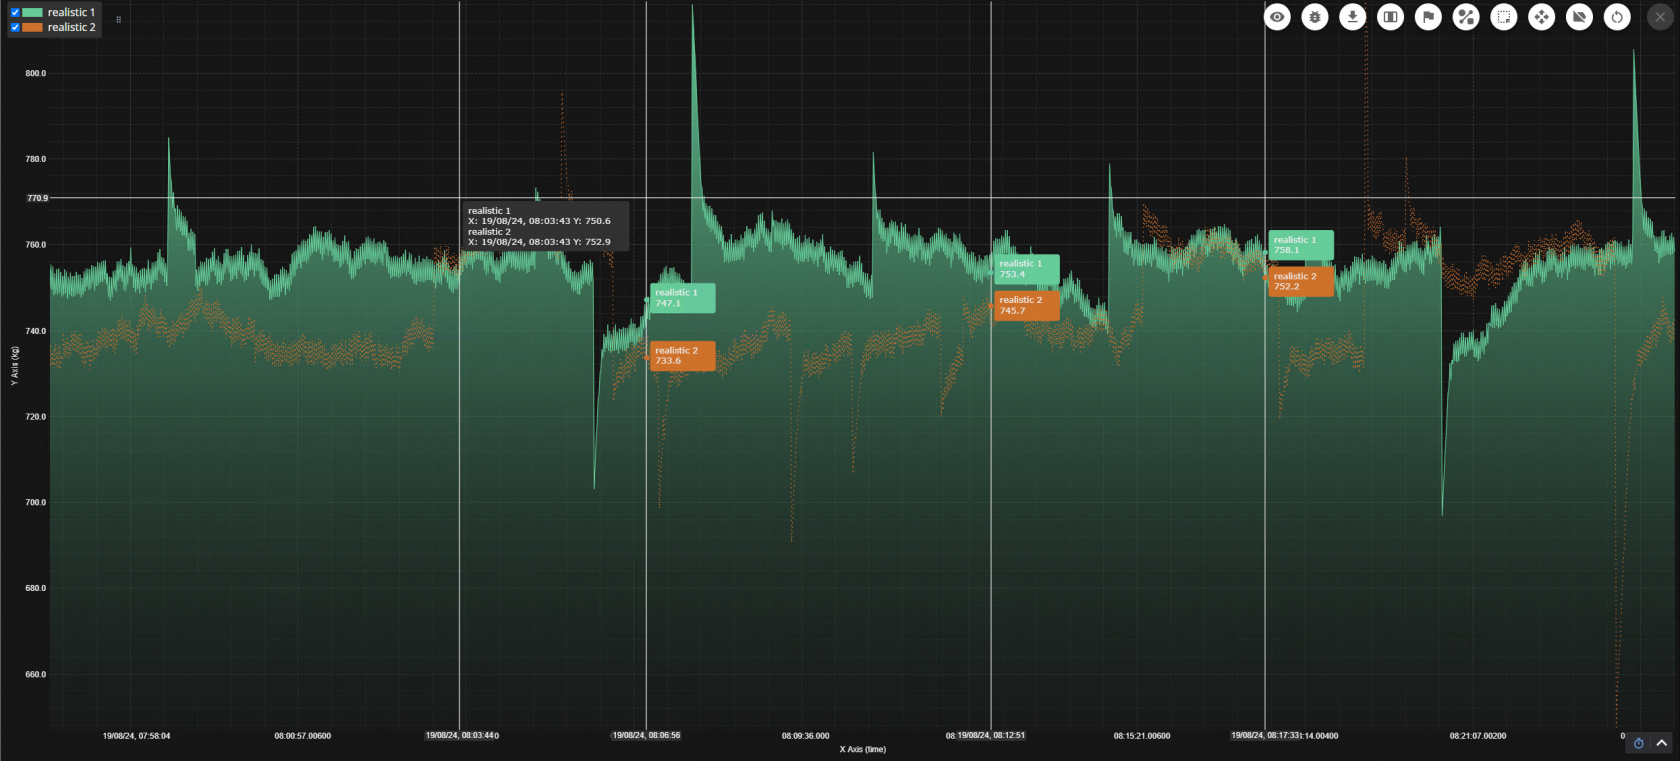
| xtrace |
Enables mouse coordinate information when hovered over |
X Trace |
| rangeBrush |
Enables range-drawing functionality |
Range Brush |
| annotation |
Allows user to add custom annotation to the chart |
Object |
| zoomToArea |
Allows the user to draw an area to zoom in to |
Zoom to Area |
ADD GRAPHIC SHOWING THE ANNOTATION????
Mode
The mode enumeration determines which interaction mode is active. The interaction menu sets this property on each mode button click. The user may choose to hide the interaction menu and script the change of this property instead.
Can be one of:
- None
- PanZoom
- Slope
- XTrace
- RangeBrush
- Annotate
- ZoomToArea
Object containing properties for the cog icon menu
| Name |
Description |
Property Type |
| visible |
Toggles visibility of the menu |
Boolean |

PlayPause
Object containing properties for the play/pause button
| Name |
Description |
Property Type |
| visible |
Toggles the visibility of the play/pause button |
Boolean |
Download as SVG, PNG
Allows the user to download an image of the chart as an SVG file
RangeBrush
Object containing properties for the rangeBrush mode
| Name |
Description |
Property Type |
| visible |
Toggles the visibility of the range brush |
Boolean |
| maxInstances |
The maximum number of concurrent ranges |
Integer |
| brush |
Object containing properties for the range brush |
Brush |
| ranges |
An array of values representing each range |
Range[] |
Brush
| Name |
Description |
Property Type |
| brush |
Object containing properties for the range brush |
Object |
| fill |
The color of the interior of the range brush |
Color |
| stroke |
The color of the stroke (outline) of the range brush |
Color |
| thickness |
The thickness of the range brush |
Integer |
| opacity |
The opacity of the range brush (1: opaque, 0: invisible) |
|
Range
| Name |
Description |
Property Type |
| xAxis |
The x axis of the range |
String |
| start |
The x coordinate of the leftmost side of the range |
Integer |
| end |
The x coordinate of the rightmost side of the range |
Integer |
Range properties are stored on a per-axis basis as an array of property objects.
XTrace
Object containing properties for the xTrace mode.

| Name |
Description |
Property Type |
| visible |
Toggles the visibility of all xTrace mode functionality |
Boolean |
| showToolTip |
Toggles the visibility of the tooltip |
Boolean |
| showAxisLabels |
Toggles the visibility of the coordinate labels along the axis |
Boolean |
| showXLine |
Toggles the visibility of the vertical line showing the x coordinate of the mouse |
Boolean |
| showYLine |
Toggles the visibility of the horizontal line showing the y coordinates of the mouse |
Boolean |
| maxInstances |
The maximum number of x-traces allowed on the chart |
Integer |
| trace |
Object containing properties for tracing functionality |
Trace |
Trace
| Name |
Description |
Property Type |
| stroke |
The color of the outline of the lines representing the coordinates of the mouse |
Color |
| thickness |
The thickness of the lines representing the coordinates of the mouse |
Integer |
| lineDash |
An array holding numeric values representing line dashing |
Array |
| fill |
The color of the fill of the lines representing the coordinates of the mouse |
Color |
| lineDash |
An array holding numeric values representing line dashing |
Array |
| font |
The font for the text present in xTrace mode |
Font |
| fontSize |
The size of the text present in xTrace mode |
Float |
Slope
| Name |
Description |
Property Type |
| slope |
Object containing properties for the slope mode |
Object |
| visible |
toggles the visibility for all slope mode functionality |
Boolean |
| maxInstances |
The maximum number of concurrent highlights |
Integer |
| line |
|
SlopeLine |
SlopeLine
| Name |
Description |
Property Type |
| line |
Object containing properties for all present lines |
Object |
| stroke |
The color of the outline of slope mode lines |
Color |
| thickness |
The thickness of slope mode lines |
Integer |
| lineDash |
An array holding numeric values representing line dashing |
Array |
| opacity |
The opacity of slope mode lines (1: opaque, 0: invisible) |
|
Slope.Label
| Name |
Description |
Property Type |
| label |
Object containing properties for the line label |
Object |
| stroke |
The color of the outline of the line label |
Color |
| fill |
The color of the interior of the line label |
Color |
| fontFamily |
The font family of the text in the line label |
String |
| fontSize |
The size of the text in the line label |
Float |
Slope.AxisHighlight
| Name |
Description |
Property Type |
| axisHighlight |
Object containing properties for the highlights applied to each axis when selected |
Object |
| fill |
The color of the axis highlight interior |
Color |
| stroke |
The color of the axis highlight outline |
Color |
| thickness |
The thickness of axis highlight outline |
Integer |

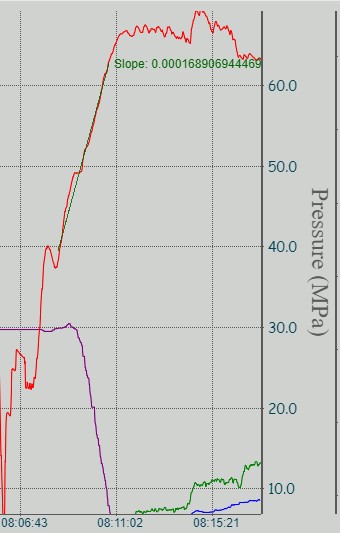
Finding the slope between 2 points on the chart is easy using the slope mode
ZoomToArea
| Name |
Description |
Property Type |
| zoomToArea |
Object containing properties for the zoomToArea mode |
Object |
| axisHighlight |
Toggles the visibility of all zoomToArea functionality |
Boolean |
| animated |
Toggles whether the zoom is animated or instant |
Boolean |
PanAndZoom
| Name |
Description |
Property Type |
| pinchZoom |
Object containing properties for pinch-zooming |
PinchZoom |
| zoomPan |
Object containing properties for zooming and panning |
ZoomPan |
| visible |
toggles the visibility for all zoomPan mode functionality |
Boolean |
| xAxisDrag |
Object containing properties |
Object |
| enabled |
Determines whether dragging on the x axis is enabled |
Boolean |
| yAxisDrag |
Object containing properties |
Object |
| enabled |
Determines whether dragging on the y axis is enabled |
Boolean |
| zoomExtents |
Object containing properties |
Object |
| enabled |
Determines whether zoom extents are enabled |
Boolean |
PinchZoom
| Name |
Description |
Property Type |
| enabled |
Toggles pinch-zooming functionality |
Boolean |
| horizontalGrowthFactor |
Affects the zoom rate |
Float |
| verticalGrowthFactor |
Affects the zoom rate |
Float |
ZoomPan
| Name |
Description |
Property Type |
| enabled |
Toggles panning functionality |
Boolean |
| axes |
An object containing all axes with zoomPan functionality enabled. |
Object |
| x |
All x axes with zoomPan enabled |
Array |
| y |
All y axes with zoomPan enabled |
Array |
| executeOn |
The input that triggers panning |
Enum (add ref) |
If the axes prop is left empty, Ignition will behave as though it contains all axes.
PanAndZoom.ZoomPan.xyDirection
| Name |
Description |
Property Type |
| xyDirection |
Determines panning functionality on each axis |
Object Member |
| xDirection |
Allows panning only on the x axis |
String |
| yDirection |
Allows panning only on the y axis |
String |
| xyDirection |
Allows free panning on both axes |
String |
MouseWheelZoom
Object containing properties for mouse wheel zooming
| Name |
Description |
Property Type |
Default |
| enabled |
Determines whether mouse wheel zooming is enabled |
Boolean |
true |
| growFactor |
Determines the rate of mouse wheel zooming (Should be set to a small number |
Float |
0.001 |
| axes |
An object containing all axes with zoomPan functionality enabled. |
Object |
{} |
| x |
All x axes with mouse wheel zooming enabled |
Array |
[] |
| y |
All y axes with mouse wheel zooming enabled |
Array |
[] |
Overview
| Name |
Description |
Property Type |
| overview |
Object containing basic properties |
Object |
| visible |
Determines visibility |
Boolean |
| height |
??? |
Integer |
| axes |
??? |
Object |
| x |
|
Array |
| y |
|
Array |
Annotation
| Name |
Description |
Property Type |
| annotation |
Sets the annotation properties |
Object |