Chart Properties
Data
| Name |
Description |
Property Type |
| data |
An array of objects for trend data |
Array |
Data Array Object
| Name |
Description |
Property Type |
| name |
The name of the data object member |
String |
| dataset |
Contains the data points for the plot |
Dataset |
| containsNaN |
Specifies if NaN values are in the dataset |
Boolean |
| isSorted |
Specifies if the values in the dataset are sorted |
Boolean |
Example of Data Prop:
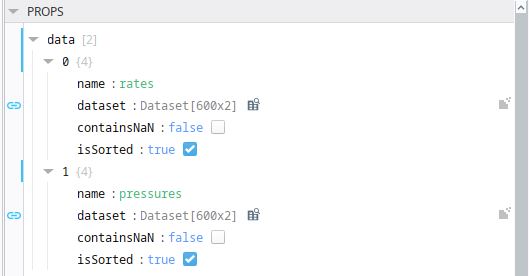
It is helpful to have the the dataset structured with timestamp in the first column.
Axes
| Name |
Description |
Property Type |
| axes |
An object containing defined axes arrays for both x and y |
Object |
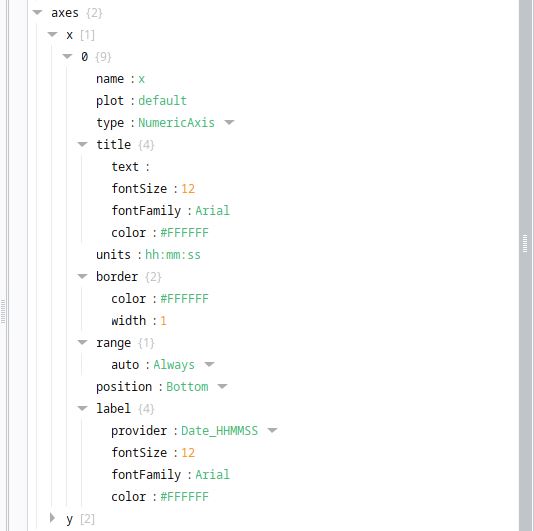
X Axis Array Object
| Name |
Description |
Property Type |
| name |
The name of the axis |
String |
| plot |
The type of plot displayed. Default value is default |
String |
| type |
The axis type for the plot |
Type |
| title |
The title for the axis |
Title |
| units |
Specifies the units of measure for axis title |
String |
| border |
Control for the axis border |
Border |
| range |
Controls the range of the axis |
Range |
| position |
Controls the position of the axis on the chart. Options are Left, Right, Up, and Down |
String |
| label |
The label configuration for the axis |
Label |
⮱Type
| Name |
Description |
Property Type |
| CategoryAxis |
Text axis suitable to chart out text based items or categories |
String |
| DateTimeNumericAxis |
Value axis suitable when the axis data is DateTime |
String |
| NumericAxis |
Value axis suitable when the axis data is numeric |
String |
| LogarithmicAxis |
Value axis suitable for numeric data to be presented in logarithmic |
String |
⮱Title
| Name |
Description |
Property Type |
Default |
| text |
The displayed axis title |
String |
X Axis |
| fontSize |
Font configuration for the title |
Double |
12 |
| fontFamily |
Specifies the font for the title. Examples are Arial, Times, etc. |
String |
Arial |
| color |
Specifies the color for the title |
Color |
--neutral-90 |
⮱Border
| Name |
Description |
Property Type |
Default |
| color |
Controls the border color |
Color |
--neutral-90 |
| width |
Controls the border thickness of the axis |
Double |
1 |
⮱Label
| Name |
Description |
Property Type |
Default |
| provider |
See details for this object and its members below... |
|
NoFormat |
| fontSize |
Font size configuration for the label |
Double |
12 |
| fontFamily |
Specifies the font family for the label. Examples are Arial, Times, etc. |
String |
Arial |
| color |
Specifies the color for the label |
Color |
--neutral-90 |
⮱Range.Auto
| Name |
Description |
Property Type |
| Always |
Autorange the IAxis instance always. In this case zooming is not allowed by user. Only AxisDragModifier UI interaction is allowed. |
String |
| Never |
Never autoranges the the IAxis instance. |
String |
| Once |
Allows the IAxis instance decide whether autorange or not when VisibleRange is null or undefined |
String |
Y Axis Array Object
| Name |
Description |
Property Type |
| name |
The name of the axis |
String |
| plot |
The type of plot displayed. Default value is default |
String |
| type |
The axis type for the plot |
Type |
| title |
The title for the axis |
Title |
| units |
Specifies the units of measure for axis title |
String |
| border |
Control for the axis border |
Border |
| range |
Controls the range of the axis |
Range |
| position |
Controls the position of the axis on the chart. Options are Left, Right, Up, and Down |
String |
| label |
The label configuration for the axis |
Label |
⮱Type
| Name |
Description |
Property Type |
| CategoryAxis |
Text axis suitable to chart out text based items or categories |
String |
| DateTimeNumericAxis |
Value axis suitable when the axis data is DateTime |
String |
| NumericAxis |
Value axis suitable when the axis data is numeric |
String |
| LogarithmicAxis |
Value axis suitable for numeric data to be presented in logarithmic |
String |
⮱Title
| Name |
Description |
Property Type |
Default |
| text |
The displayed axis title |
String |
Y Axis |
| fontSize |
Font configuration for the title |
Double |
12 |
| fontFamily |
Specifies the font for the title. Examples are Arial, Times, etc. |
String |
Arial |
| color |
Specifies the color for the title |
Color |
--neutral-90 |
⮱Border
| Name |
Description |
Property Type |
Default |
| color |
Controls the border color |
Color |
--neutral-90 |
| width |
Controls the border thickness of the axis |
Double |
1 |
⮱Label
| Name |
Description |
Property Type |
Default |
| provider |
See details for this object and its members below... |
Provider |
NoFormat |
| fontSize |
Font size configuration for the label |
Double |
12 |
| fontFamily |
Specifies the font family for the label. Examples are Arial, Times, etc. |
String |
Arial |
| color |
Specifies the color for the label |
Color |
--neutral-90 |
⮱Range.Auto
| Name |
Description |
Property Type |
| Always |
Autorange the IAxis instance always. In this case zooming is not allowed by user. Only AxisDragModifier UI interaction is allowed. |
String |
| Never |
Never autoranges the the IAxis instance. |
String |
| Once |
Allows the IAxis instance decide whether autorange or not when VisibleRange is null or undefined |
String |
Provider
| Name |
Description |
Property Type |
| provider |
An object containing formats for the axis label |
Object |
⮱Provider Members
| Name |
Description |
Property Type |
| NoFormat |
Specifies No Formatting to the axis labels (defaults to integer whole values) |
String |
| Decimal |
Formats the axis labels with a single decimal place |
String |
| SignificantFigures |
Formats the axis labels as a whole number (no decimal places) |
String |
| Date_DDMMYYYY |
Formats the axis label to DateTime (eg. 12/31/1969) |
String |
| Date_DDMMYY |
Formats the axis label to DateTime (eg. 01/01/70) |
String |
| Date_DDMMHHMM |
Formats the axis label to DateTime (eg. 01/01 00:00) |
String |
| Date_DDMM |
Formats the axis label to DateTime (eg. 01/01/70) |
String |
| Date_HHMM |
Formats the axis label to DateTime (eg. 01/01) |
String |
| Date_HHMMSS |
Formats the axis label to DateTime (eg. 00:00) |
String |
| Exponential |
Formats the axis label to exponential notation (eg. 2.0e+1) |
String |
| Scientific |
Formats the axis label to scientific notation (eg. 3x10³) |
String |
Pens Array Object
| Name |
Description |
Property Type |
| |
An array of pens to display on the graph |
Array |
| name |
The name of the pen to be displayed in the legend on the chart |
String |
| visible |
Determines if the pen is visible on the chart or not |
Boolean |
| type |
The chart type desired. Options are Line, Scatter, Column, Mountain and Spline |
String |
| interpolationPoints |
Used with the Spline and MountainSpline type curves to set the interpolation filter - a higher value results in a smoother waveform - only visible when MountainSpline or Spline curves are selected |
Integer |
| axis |
Defines the axes (x and y) for the selected pen |
Axis |
| data |
Defines where the data for the pen is coming from |
Data |
| stroke |
Configuration of the line on the chart corresponding to a specific pen |
Stroke |
Fill
Fill and gradient properties will not appear in the Ignition Designer for line and spline type pens.
| Name |
Description |
Property Type |
| color |
The color of the fill of mountain, column, and scatter type pens. |
Color |
| gradient |
Object containing properties for the appearance of the fill of mountain, column, and scatter type pens, allowing for highly configurable color gradients. |
Fill.Gradient |
⮱Fill.Gradient
| Name |
Description |
Property Type |
| startPoint.x/y |
The starting point of the gradient. This value is relative to the screen rather than the chart - (0,0) is the top left of the screen, and (1,1) is the bottom right. |
Float |
| endPoint.x/y |
The end point of the gradient. This value is relative to the screen rather than the chart - (0,0) is the top left of the screen, and (1,1) is the bottom right. |
Float |
| gradientStops.i.offset |
The location, relative to the screen, of this gradient stop's color. Any number of gradient stops and their corresponding offsets and colors can be added to make the gradient more complex. Gradient stops must be added in the correct order, so that each offset is greater than the one after it. |
Float |
Type
| Name |
Description |
Property Type |
| Line |
A series of data points connected by line segments |
String |
|
Scatter
|
Shows large quantities of data along a horizontal and vertical axis and presents a correlation between two variables |
String |
| Column |
A type of graph that uses vertical bars or columns to represent the values of the data |
String |
| Mountain |
Essentially the same as a line chart with the area filled in under the curve |
String |
| MountainSpline |
A spline chart with the area under the curve filled in |
String |
| Spline |
A line chart where the data points are connected using spline interpolation |
String |
Axis
| Name |
Description |
Property Type |
| x |
Sets the pen x axis to the named x axis in the axes array object |
String |
|
y
|
Sets the pen y axis to the named y axis in the axes array object |
String |
Data
| Name |
Description |
Property Type |
| name |
The name for where the data for the pen is coming from - corresponds to the name member of the Data array object |
String |
| xColumnName |
The column from the dataset in the Data array that is to be used for the X axis |
String |
| yColumnName |
The column from the dataset in the Data array that is to be used for the Y axis |
String |
Stroke
| Name |
Description |
Property Type |
| color |
The color applied to the line stroke |
Color |
| dashArray |
The spacing between dashes of the line stroke - enter an even number of float values to create a repeating pattern. |
Array |
| opacity |
The opacity to apply to the line stroke. 0 = Transparent, 1 = Opaque. |
Float |
| width |
The width to apply to the line stroke
|
Integer |
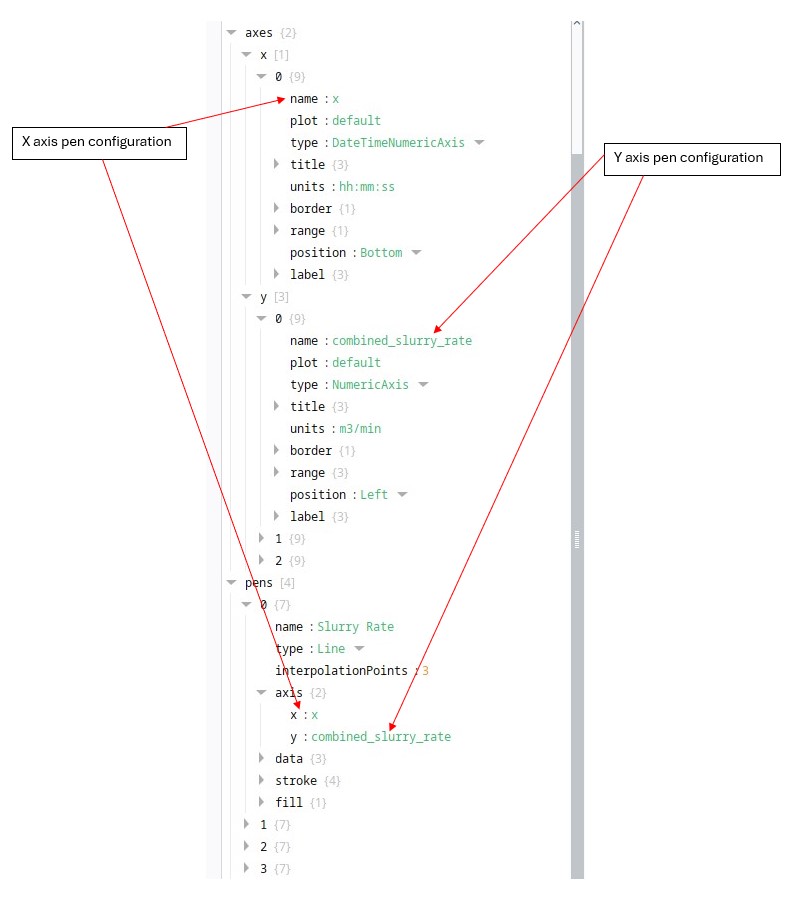
ADD SCREENSHOT OF PENS????
When configuring pens, it is important to ensure that the pen axes correspond to the specific x and y axes that are configured in the props section (see below).
Chart
| Name |
Description |
Property Type |
| height |
The size of the chart on the y axis (as a %) |
String |
| legend |
Props for the legend at the top left |
Legend |
Legend
| Name |
Description |
Property Type |
| visible |
Determines whether the legend is displayed on the chart |
Boolean |
| showCheckBoxes |
Determines whether the checkboxes in the legend are displayed |
Boolean |