User Interactions
SC Charts allows the user to interact with data in the chart in different ways depending on the selected interaction mode and its configuration. These modes include:
The chart also includes an optional menu, legend, and overview that provide further interaction capabilities.
Note that SC Charts has not been tested extensively on mobile, and it is understood that some functionality such as right- and double-clicks do not translate to mobile.

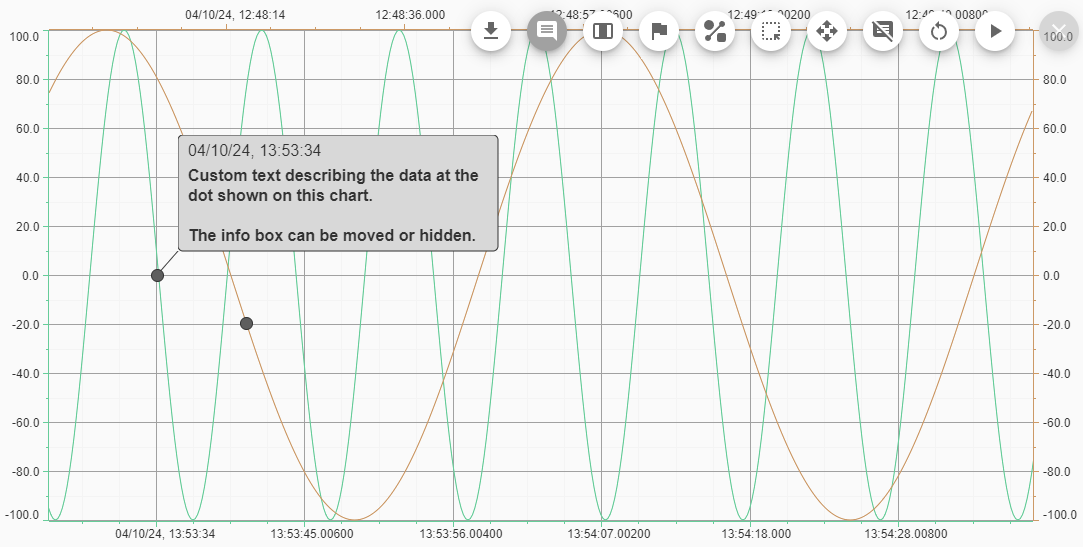
 Menu
Menu


 Download as PNG

Click to download a PNG of the current chart as displayed. This includes all visible axes, pens, the legend, the overview, annotations, range brushes, x traces, and measurements.
 Annotation

Click to select the annotate interaction mode. The button background is darker when selected to indicate the current mode.
Chart interactions in the annotation mode are described in more detail below.
 Range Brush

Click to select the range brush interaction mode. The button background is darker when selected to indicate the current mode.
Chart interactions in the range brush mode are described in more detail below.
 X Trace

Click to select the x-trace interaction mode. The button background is darker when selected to indicate the current mode.
Chart interactions in the x trace mode are described in more detail below.
 Measurement

Click to select the measure interaction mode. The button background is darker when selected to indicate the current mode.
Chart interactions in the measurement mode are described in more detail below.
 Zoom to Area

Click to select the zoom to area interaction mode. The button background is darker when selected to indicate the current mode.
Chart interactions in the zoom to area mode are described in more detail below.
 Pan And Zoom

Click to select the pan and zoom interaction mode. The button background is darker when selected to indicate the current mode.
Chart interactions in the pan and zoom mode are described in more detail below.
 Clear Annotations

Click to remove all annotations from the chart. This button is only visible when there is at least one configured annotation instance.
 Clear Range Brushes

Click to remove all range brushes from the chart. This button is only visible when there is at least one configured range brush instance.
 Clear X Traces

Click to clear all x-traces from the chart. This button is only visible when there at least one x-trace was added to the chart.
 Clear Measurements

Click to clear all measurements from the chart. This button is only visible when there is at least one configured measurement instance.
 Reset Zoom

Click to reset the axes based on the configured settings after zooming on the overview or using the pan and zoom or zoom to area interactions.

 Pause / Resume Data Updates


Click to toggle between pausing or resuming data updates. By default data for configured pens is rendered as it is added to the props. Pausing data updates can be done for analysis or to create a screenshot without having new data change the chart appearance.
Legend
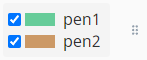
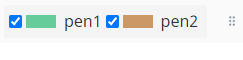
When configured, a legend with a list of all pens is shown. The color of each pen is shown to the left of its name. The legend can be moved anywhere within the chart area by clicking and dragging the handle on the right hand side.
If configured, a checkbox appears to the left of each pen color, and clicking it toggles the visibility of that pen on the chart. The legend can be configured to show pens in a vertical or horizontal orientation.
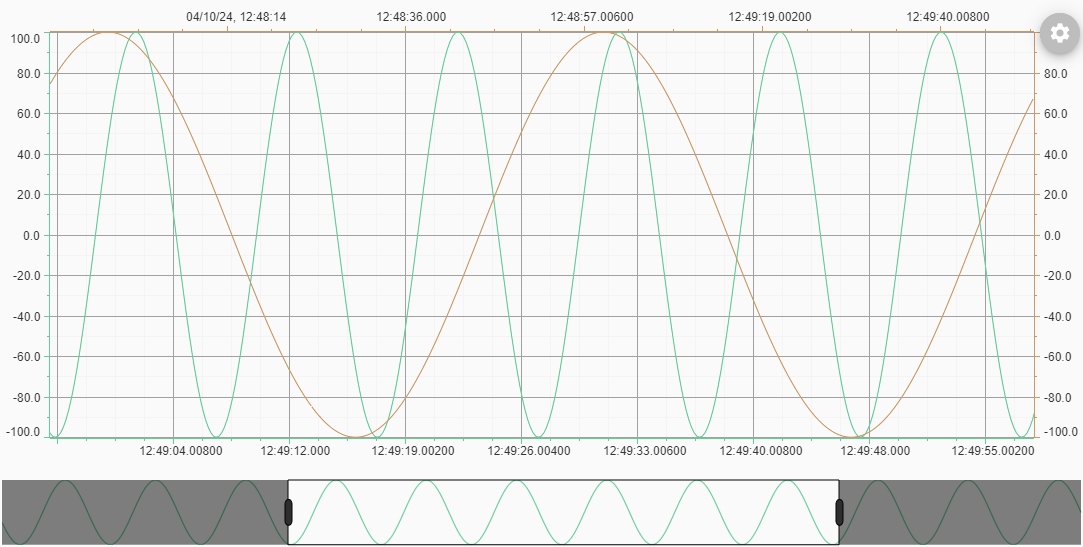
Overview
The overview appears below the main chart and shows an overview of all data for all pens on a single x- and y-axis pair as configured. It has a selected area rectangle that shows the user the x-range visible in the main chart. Dragging it or resizing it by dragging the handles updates the x-axis range on the main chart.
Interaction Modes
The interaction modes should behave intuitively or consistently. Interactions of each mode are explained in detail below.
Modes that add items to the chart, including Annotate, Range Brush, Measure, and X Trace, follow these general principles:
- Left click on the chart to add an item.
- Right click an item to remove it.
- Double click an item to select it or toggle the visibility of a related info box.
- Click and drag an item to move or modify its position.
Annotate
Annotation interactions are enabled when the chart interaction mode is set to Annotate. Annotations may be added, removed, selected, or moved. The info box may also be hidden or shown.
Add Annotation
To add an annotation, left click within the chart area.
Note that this does not work if the mouse moves slightly between mouse down and up in the click.
If the mouse click is over a pen, it will automatically be assigned the pen and its axes. Otherwise, the axis may be set by first clicking on the desired x- and y-axis, and then clicking on the chart to create the annotation.
The anchor position of the info box and thus how the line that connects the two is drawn is determined automatically based on the relative location of the dot and info box.
Remove Annotation
Remove an annotation by right clicking the dot or info box.
Select Annotation
Select an annotation by double clicking the info box. This fires the onAnnotationSelect event to enable custom functionality.
Move Annotation
Move an annotation by clicking and dragging the dot or info box. Note that moving either will reset the anchor position of the info box and the line based on the relative location of the dot and info box.
Show or Hide Annotation Info Box
Double click the dot to show or hide the annotation info box.
Change Axes
Click an x or y axis to set the default x and y axes new annotations are assigned. If a pen is clicked, the axis are assigned based on the pen's axes instead of these defaults.
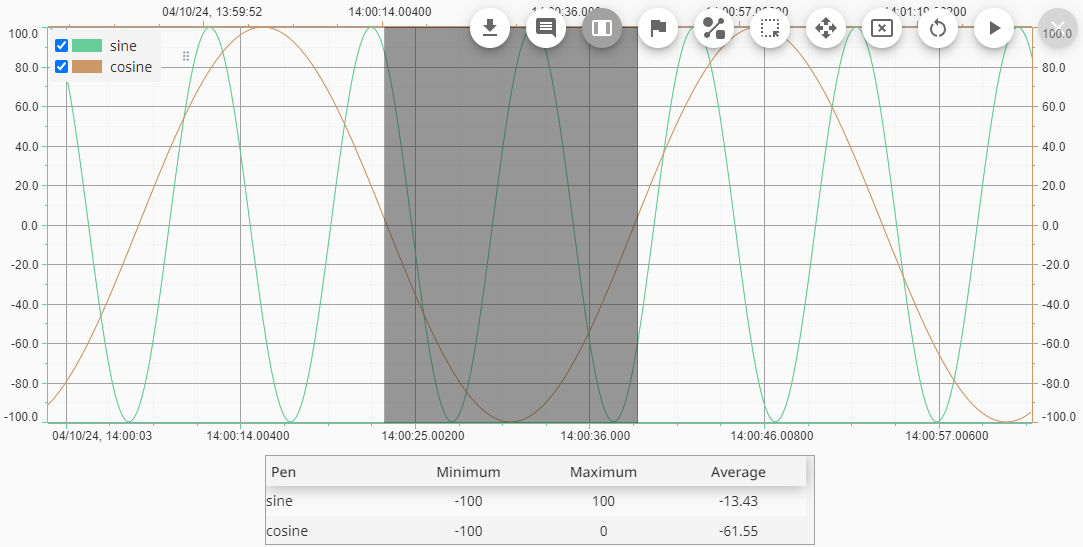
Range Brush
Range brush interactions are enabled when the chart interaction mode is set to RangeBrush. Ranges may be added, removed, selected, or modified. The range contains information that can be used to generate and display statistics in Ignition for the pens in that range.
Add Range Brush
Left click within the chart area to start adding a range brush. Move the mouse and click in a different location to complete the range.
Note that this will not work if the mouse moves slightly between mouse down and up in the click.
Remove Range Brush
Right click a range brush to remove it.
Select Range Brush
Double clicking a range brush fires the onRangeBrushSelect event to enable custom functionality..
In the future the props may be updated to include a prop to indicate the selected range brush index or different styles for the selected range brush.
Modify Range Brush
Click and drag a range brush to move it. Note that the range will be limited to the extents of the current chart area, so it will shrink if moved beyond the start or end.
To change the size of the range, click on the range and then drag one of the dots at the corners of the range rectangle.
Change X Axis
Click an x-axis to set which axis all ranges are based on. All ranges maintain the start and end x-coordinates of the selected x-axis when panning and zooming.
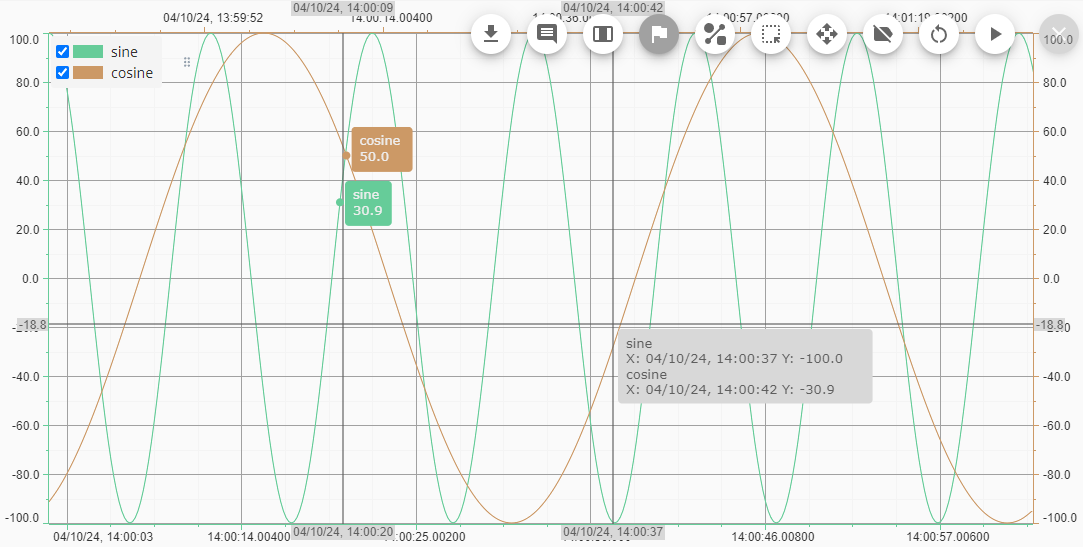
X Trace
X Trace interactions are enabled when the chart interaction mode is set to XTrace. Traces may be added, removed, or modified. In x-trace mode, an info box follows the mouse pointer with information about the nearest data values of each series shown. Fixed x-traces are added at a relative position in the chart, so they do not move and the nearest values update when the data changes.
Add X Trace
Left click within the chart area to add an x-trace at the relative x-position in the chart.
Remove X Trace
Right click an x-trace to remove it. The oldest x-traces are removed when a new x-trace is added that would exceed the maximum number of x-trace instances.
Move X Trace
Move and x-trace by dragging it in the chart.
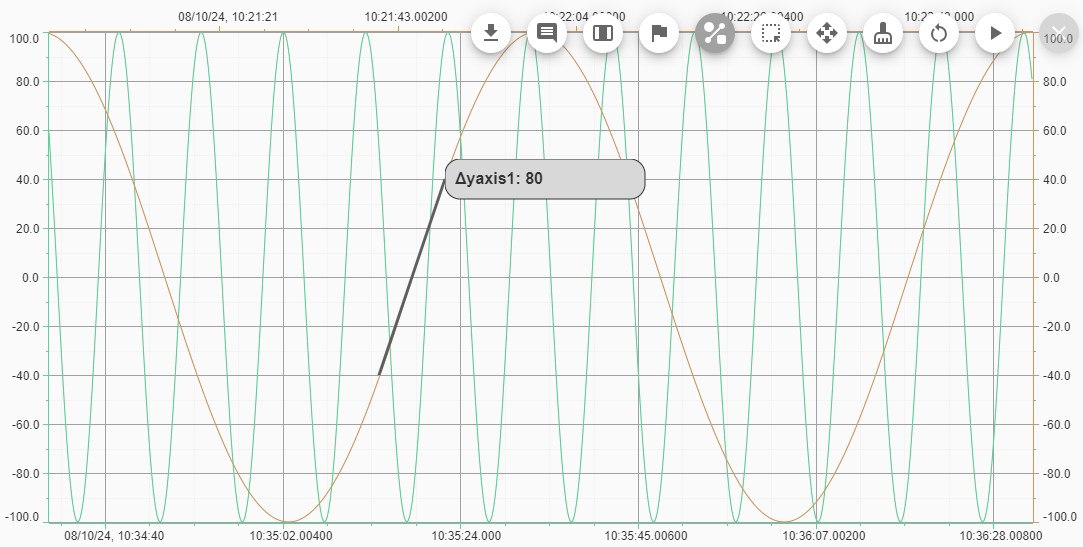
Measure
Measurement interactions are enabled when the chart interaction mode is set to Measure. Measurements may be added, removed, selected, or moved. The info box may also be hidden or shown. By default, the measurement text shows the difference between the y-values of the points defining the measurement line. Custom scripting can be added to show the difference between x-values or the slope of the line.
Add Measurement
To add a measurement, left click within the chart area. The first x- and y-axes are used by default, but they may be set by first clicking on the desired x- and y-axis and then clicking on the chart to create the measurement.
Note that this will not work if the mouse moves slightly.
Remove Measurement
Remove a measurement by right clicking the line or info box.
Select Measurement
Select a measurement by double clicking the info box. This fires the onMeasurementSelect event to enable custom functionality..
Modify Measurement
Move a measurement by clicking and dragging the line or info box. Note that each are moved independently.
To change one end of a measurement, click on it and drag one of the dots at the ends of the line.
Show or Hide Measurement Info Box
Double click the measurement line to show or hide the info box.
Change Axes
Click an x- or y-axis to set the x- and y-axes new measurements are based on.
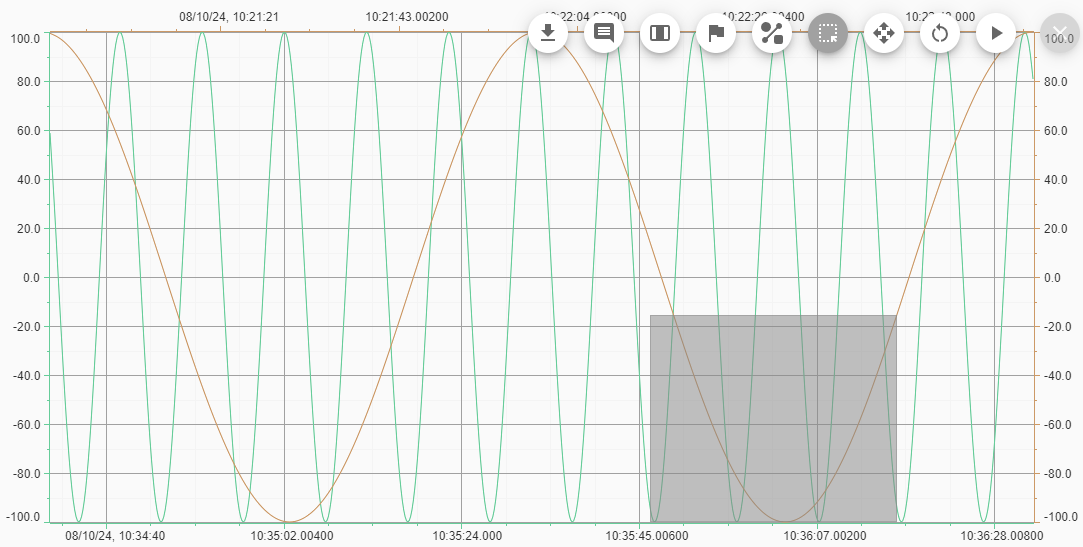
Zoom to Area
Zoom to area interactions are enabled when the chart interaction mode is set to ZoomToArea. This allows a user to zoom to an area by selecting a rectangular area on the chart. Click and drag to select the area to zoom to.
Pan and Zoom
Pan and zoom interactions are enabled when the interaction mode is set to PanZoom. There are five interaction types that can be configured individually and are all enabled by default. They are described in more detail in the following subsections. The x- and y-axis drag interactions provide unique feedback by highlighting an area along an axis that a user selects to zoom to.
Zoom Pan
Pan the chart by clicking on it and dragging the mouse. By default this applies when the left mouse button is clicked. Depending on the configuration, this may only pan a subset of the chart axes. On touch devices, this mode also includes the Pinch Zoom interaction.
Pinch Zoom
Zoom in or out on touch devices by moving two fingers on the chart in opposite directions.
X Axis Drag
Click and drag an x-axis to pan or zoom to a range. By default, the left mouse button pans the chart and the middle and right buttons zoom to the range. The area to zoom to is highlighted on the axis while the mouse button is depressed.
Y Axis Drag
Click and drag a y-axis to pan or zoom to a range. By default, the left mouse button pans the chart and the middle and right buttons zoom to the range. The area to zoom to is highlighted on the axis while the mouse button is depressed.
Zoom Extents
Double click on the chart to set the range of each axis to display all input data on all visible pens. When an axis is double clicked it will be set to the extent of the data for all visible pens configured on that axis.
Mouse Wheel Zoom
Mouse wheel zoom interactions are configured in the chart props and are not exposed on the menu. Depending on the configuration, this may only zoom a subset of the chart axes.
Chart
When the mouse is over the chart, scroll the mouse wheel or an axis to zoom in or out around that point.
Axis
Each axis can be zoomed individually around a point by scrolling the mouse wheel when the mouse is pointing to that axis.