User Interactions
SC Charts allows the user to interact with data in the chart in different ways depending on the selected interaction mode and its configuration. These modes include:
-
Annotate
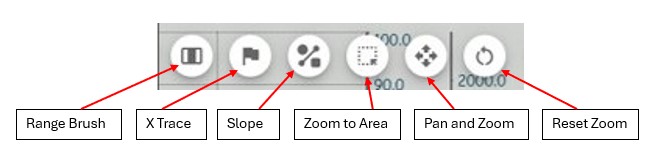
- Range Brush
- X Trace
- Slope
- Zoom To Area
- Pan And Zoom
The chart also includes an optional menu, legend, and overview that provide further interaction capabilities.
Menu
Menu Buttons
NEED TO UPDATE THE SCREENSHOT - Add annotate, pause/play, clear; show gear
Download PNG
Click to download a PNG of the current chart as displayed. This includes all visible axes, pens, the legend, the overview, annotations, range brushes, x traces, and slope lines.
Annotate
Click to select the annotation interaction mode. The button background is darker when selected to indicate the current mode.
Interactions in the annotation mode are described in more detail below.
Range Brush
Click to select the range brush interaction mode. The button background is darker when selected to indicate the current mode.
Interactions in the range brush mode are described in more detail below.
X Trace
Click to select the x trace interaction mode. The button background is darker when selected to indicate the current mode.
Interactions in the x trace mode are described in more detail below.
Slope (will be Measure)
Click to select the measurement interaction mode. The button background is darker when selected to indicate the current mode.
Interactions in the measurement mode are described in more detail below.
Zoom to Area
Click to select the zoom to area interaction mode. The button background is darker when selected to indicate the current mode.
Interactions in the zoom to area mode are described in more detail below.
Pan And Zoom
Click to select the pan and zoom interaction mode. The button background is darker when selected to indicate the current mode.
Interactions in the pan and zoom mode are described in more detail below.
Clear Annotations
Click to remove all annotations from the chart. This button is only visible when there is at least one configured annotation.
Clear Range Brushes
Click to remove all range brushes from the chart. This button is only visible when there is at least one configured range brush.
Clear X Traces
Click to clear all x traces from the chart. This button is only visible when there at least one x trace was added to the chart.
Clear Measurements
Click to clear all slope lines from the chart. This button is only visible when there is at least one configured measurement.
Reset Zoom
Click to reset the axes based on the configured settings after zooming on the overview or using the pan and zoom or zoom to area interactions.
Pause / Resume Data Updates
Click to toggle between pausing or resuming data updates. By default all data is rendered as it is added to the props. Pausing data updates can be done for analysis or to create a screenshot without having new data change things.
Legend
ADD SCREENSHOT
When configured, a legend with a list of all pens is shown. The color of each pen is shown to the left of its name. The legend can be moved anywhere within the chart area by clicking and dragging the handle on the right hand side.
If configured, a checkbox appears to the left of each pen color, and clicking it toggles the visibility of that pen on the chart.
Overview
ADD SCREENSHOT
The overview appears below the main chart and shows an overview of all data for all pens on a single x and y axis pair as configured. It has a selected area rectangle with handles that shows the user the x range visible in the main chart and allows the user to change the x range.
(FROM THE SCICHARTS DOCS - NOT SURE IF WE CAN COPY IT:
https://www.scichart.com/documentation/js/current/webframe.html#SciChartOverview.html
Dragging or resizing the selection area on the overview will automatically update the visible range of the main chart, and zooming/panning the main chart will update the selection on the overview.)
Annotate
ADD SCREENSHOT
Add Annotation
Remove Annotation
Select Annotation
Move Annotation
Show or Hide Annotation Info Box
Range Brush
ADD SCREENSHOT
Add Range Brush
Remove Range Brush
Select Range Brush
Move Range Brush
X Trace
ADD SCREENSHOT
Add X Trace
Remove X Trace
Move X Trace
Measure
ADD SCREENSHOT
Add Measurement
Remove Measurement
Select Measurement
Move Measurement
Show or Hide Measurement Info Box
Zoom to Area
ADD SCREENSHOT
Mouse Wheel Zoom
This mode is configured in the chart props and is not exposed on the menu.
Chart
When enabled a user can use the mouse wheel to zoom in or out on a chart.
Axis
Each axis can be zoomed individually by using the mouse wheel when the mouse is over that axis.
Pan and Zoom
ADD SCREENSHOT
Zoom Pan
Pinch Zoom
X Axis Drag
Y Axis Drag
Zoom Extents
When enabled and a user double clicks on the chart, zoom extents results in each axis being set to display all input data on all visible pens. When an axis is double clicked it will be set to the extent of the data for all visible pens configured on that axis.