Chart Properties
Data
| Name | Description | Property Type |
|---|---|---|
| data | An array of objects for trend data | Array |
Data Array Object
| Name | Description | Property Type |
|---|---|---|
| name | The name of the data object member | String |
| dataset | Contains the data points for the plot | Dataset |
| containsNaN | Specifies if NaN values are in the dataset | Boolean |
| isSorted | Specifies if the values in the dataset are sorted | Boolean |
Example of Data Prop:
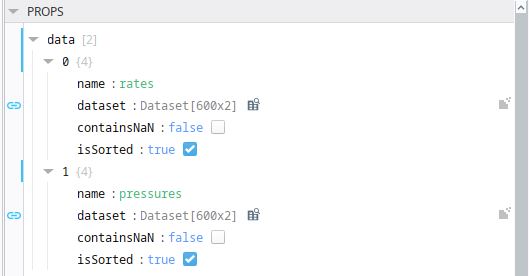
It is helpful to have the the dataset structured with timestamp in the first column.
Plots: (Future Release)
| Name | Description | Property Type |
|---|---|---|
Axes
| Name | Description | Property Type |
|---|---|---|
| axes | An object containing defined axes arrays for both x and y | Object |
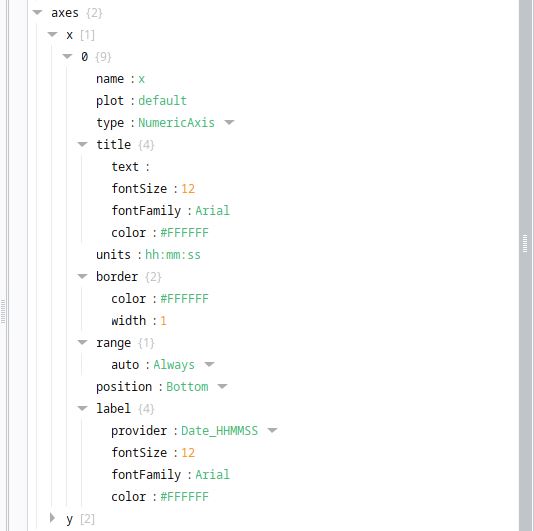
X Axis Array Object
| Name | Description | Property Type |
|---|---|---|
| name | The name of the axis | String |
| plot | The type of plot displayed. Default value is default | String |
| type | The axis type for the plot | Object |
| title | The title for the axis | Object |
| units | Specifies the units of measure for axis title | String |
| border | Control for the axis border | Object |
| range | Controls the range of the axis | Object |
| position | Controls the position of the axis on the chart. Options are Left, Right, Up, and Down | String |
| label | The label configuration for the axis | Object |
Type
| Name | Description | Property Type |
| CategoryAxis | Text axis suitable to chart out text based items or categories | String |
| DateTimeNumericAxis | Value axis suitable when the axis data is DateTime | String |
| NumericAxis | Value axis suitable when the axis data is numeric | String |
| LogarithmicAxis | Value axis suitable for numeric data to be presented in logarithmic | String |
Title
| Name | Description | Property Type | Default |
| text | The displayed axis title | String | X Axis |
| fontSize | Font configuration for the title | Double | 12 |
| fontFamily | Specifies the font for the title. Examples are Arial, Times, etc. | String | Arial |
| color | Specifies the color for the title | String | --neutral-90 |
Border
| Name | Description | Property Type | Default |
| color | Controls the border color | String | --neutral-90 |
| width | Controls the border thickness of the axis | Double | 1 |
Label
| Name | Description | Property Type | Default |
| provider | See details for this object and its members below... | NoFormat | |
| fontSize | Font size configuration for the label | Double | 12 |
| fontFamily | Specifies the font family for the label. Examples are Arial, Times, etc. | String | Arial |
| color | Specifies the color for the label | String | --neutral-90 |
Range.Auto
| Name | Description | Property Type |
| Always | Autorange the IAxis instance always. In this case zooming is not allowed by user. Only AxisDragModifier UI interaction is allowed. | String |
| Never | Never autoranges the the IAxis instance. | String |
| Once | Allows the IAxis instance decide whether autorange or not when VisibleRange is null or undefined | String |
Y Axis Array Object
| Name | Description | Property Type |
|---|---|---|
| name | The name of the axis | String |
| plot | The type of plot displayed. Default value is default | String |
| type | The axis type for the plot | Object |
| title | The title for the axis | Object |
| units | Specifies the units of measure for axis title | String |
| border | Control for the axis border | Object |
| range | Controls the range of the axis | Object |
| position | Controls the position of the axis on the chart. Options are Left, Right, Up, and Down | String |
| label | The label configuration for the axis | Object |
Type
| Name | Description | Property Type |
| CategoryAxis | Text axis suitable to chart out text based items or categories | String |
| DateTimeNumericAxis | Value axis suitable when the axis data is DateTime | String |
| NumericAxis | Value axis suitable when the axis data is numeric | String |
| LogarithmicAxis | Value axis suitable for numeric data to be presented in logarithmic | String |
Title
| Name | Description | Property Type | Default |
| text | The displayed axis title | String | Y Axis |
| fontSize | Font configuration for the title | Double | 12 |
| fontFamily | Specifies the font for the title. Examples are Arial, Times, etc. | String | Arial |
| color | Specifies the color for the title | String | --neutral-90 |
Border
| Name | Description | Property Type | Default |
| color | Controls the border color | String | --neutral-90 |
| width | Controls the border thickness of the axis | Double | 1 |
Label
| Name | Description | Property Type | Default |
| provider | See details for this object and its members below... | NoFormat | |
| fontSize | Font size configuration for the label | Double | 12 |
| fontFamily | Specifies the font family for the label. Examples are Arial, Times, etc. | String | Arial |
| color | Specifies the color for the label | String | --neutral-90 |
Range.Auto
| Name | Description | Property Type |
| Always | Autorange the IAxis instance always. In this case zooming is not allowed by user. Only AxisDragModifier UI interaction is allowed. | String |
| Never | Never autoranges the the IAxis instance. | String |
| Once | Allows the IAxis instance decide whether autorange or not when VisibleRange is null or undefined | String |
Provider
| Name | Description | Property Type |
|---|---|---|
| provider | An object containing formats for the axis label | Object |
Provider Members
| Name | Description | Property Type |
|---|---|---|
| NoFormat | Specifies No Formatting to the axis labels (defaults to integer whole values) | String |
| Decimal | Formats the axis labels with a single decimal place | String |
| SignificantFigures | Formats the axis labels as a whole number (no decimal places) | String |
| Date_DDMMYYYY | Formats the axis label to DateTime (eg. 12/31/1969) | String |
| Date_DDMMYY | Formats the axis label to DateTime (eg. 01/01/70) | String |
| Date_DDMMHHMM | Formats the axis label to DateTime (eg. 01/01 00:00) | String |
| Date_DDMM | Formats the axis label to DateTime (eg. 01/01/70) | String |
| Date_HHMM | Formats the axis label to DateTime (eg. 01/01) | String |
| Date_HHMMSS | Formats the axis label to DateTime (eg. 00:00) | String |
| Exponential | Formats the axis label to exponential notation (eg. 2.0e+1) | String |
| Scientific | Formats the axis label to scientific notation (eg. 3x10³) | String |
Pens Array Object
| Name | Description | Property Type |
|---|---|---|
| An array of pens to display on the graph | Array | |
| name | The name of the pen to be displayed in the legend on the chart | String |
| visible | Determines if the pen is visible on the chart or not | Boolean |
| type | The chart type desired. Options are Line, Scatter, Column, Mountain and Spline | String |
| interpolationPoints | Used with the Spline and MountainSpline type curves to set the interpolation filter - a higher value results in a smoother waveform - only visible when MountainSpline or Spline curves are selected | Integer |
| axis | Defines the axes (x and y) for the selected pen | Object |
| data | Defines where the data for the pen is coming from | Object |
| stroke | Configuration of the line on the chart corresponding to a specific pen | Object |
Type
| Name | Description | Property Type |
| Line | A series of data points connected by line segments | String |
|
Scatter |
Shows large quantities of data along a horizontal and vertical axis and presents a correlation between two variables | String |
| Column | A type of graph that uses vertical bars or columns to represent the values of the data | String |
| Mountain | Essentially the same as a line chart with the area filled in under the curve | String |
| MountainSpline | A spline chart with the area under the curve filled in | String |
| Spline | A line chart where the data points are connected using spline interpolation | String |
Axis
| Name | Description | Property Type |
| x | Sets the pen x axis to the named x axis in the axes array object | String |
|
y |
Sets the pen y axis to the named y axis in the axes array object | String |
Data
| Name | Description | Property Type |
| name | The name for where the data for the pen is coming from - corresponds to the name member of the Data array object | String |
| xColumnName | The column from the dataset in the Data array that is to be used for the X axis | String |
| yColumnName | The column from the dataset in the Data array that is to be used for the Y axis | String |
Stroke
| Name | Description | Property Type |
| color | The color applied to the line stroke | String |
| dashArray | The spacing between dashes of the line stroke | Array |
| opacity | The opacity to apply to the line stroke (numeric value) | Integer |
| width | The width to apply to the line stroke (numeric value) | Integer |
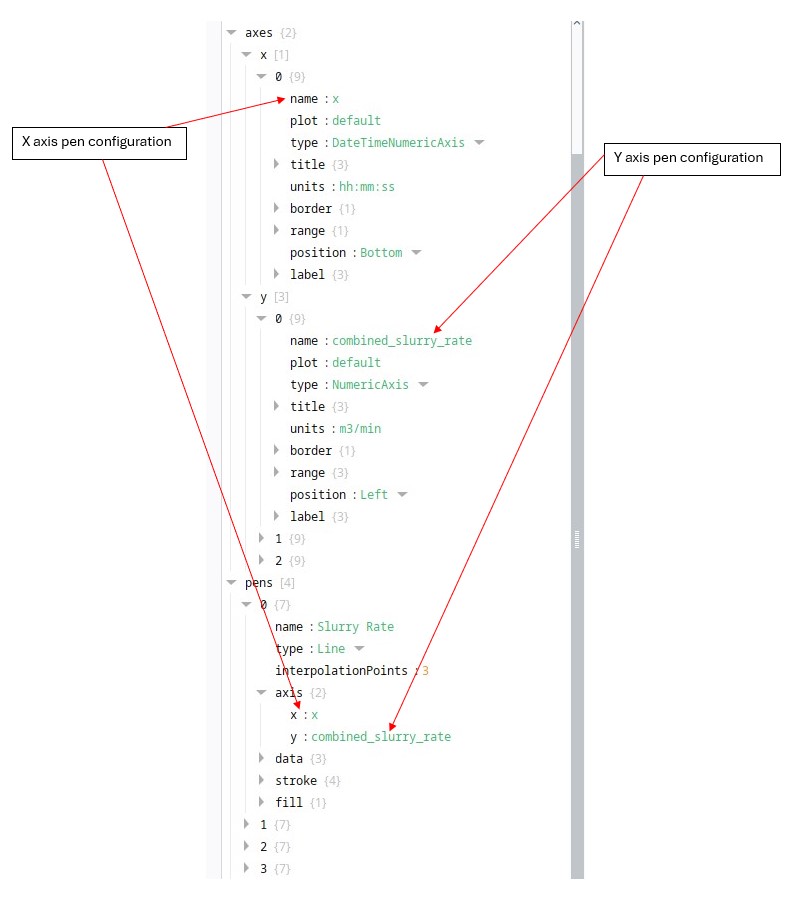
ADD SCREENSHOT OF PENS????
When configuring pens, it is important to ensure that the pen axes correspond to the specific x and y axes that are configured in the props section (see below).
Chart
| Name | Description | Property Type |
|---|---|---|
| height | The size of the chart on the y axis (as a %) | String |
| legend | Props for the legend at the top left | Object |
Legend
| Name | Description | Property Type |
|---|---|---|
| visible | Determines whether the legend is displayed on the chart | Boolean |
| showCheckBoxes | Determines whether the checkboxes in the legend are displayed | Boolean |
Theme
| Name | Description | Property Type | Default |
| axisBorder | sets the color for the axis border | String | --neutral-90 |
| axistitleColor | sets the color for the title of the axis | String | --neutral-90 |
| annotationsGripsBackroundBrush | sets default brush for background of the annotations grips | String | --neutral-90 |
| annotationsGripsBorderBrush | sets default brush for border of the annotations grips | String | --neutral-90 |
| axis3DBandsFill | sets the color for the 3D Chart Axis plane bands fill | String | transparent |
| axisBandsFill | sets the color for the axis bands fill | String | transparent |
| axisPlaneBackgroundFill | sets the color for the 3D Chart Axis plane background fill | String | transparent |
| chartTitleColor | sets the color for the chart title | String | --neutral-90 |
| columnFillBrush | sets the brush for column fill | String | transparent |
| columnLineColor | sets the color for the column line | String | transparent |
| cursorLineBrush | sets the brush for the line stroke | String | --neutral-90 |
| defaultColorMapBrush | sets the default brush for the SciChart.Charting.Visuals.RenderableSeries.BaseHeatmapRenderableSeries.ColorMap. Accepts . Gradient Stops are used to compute colors of the final heat signature | Array | |
| downBandSeriesFillColor | sets the default color for the down band fill color | String | transparent |
| downBandSeriesLineColor | sets the default color for the SciChart.Charting.Visuals.RenderableSeries.BaseRenderableSeries.Stroke, which defines the down band line color | String | transparent |
| downBodyBrush | sets the Brush used for candle body on down-candles (close < open). If null, UpBodyColor property is used. | String | transparent |
| downWickColor | sets the Color used for wicks and outlines on down-candles (close < open). | String | transparent |
| gridBackgroundBrush | sets the brush for the grid background | String | transparent |
| gridBorderBrush | sets the brush used for Gridlines area border | String | transparent |
| labelBackgroundBrush | sets the brush for the label background | String | transparent |
| labelBorderBrush | sets a brush that describes the label border background | String | transparent |
| labelForegroundBrush | sets a brush that describes the label border foreground | String | --neutral-90 |
| legendBackgroundBrush | sets a brush that describes the legend border background | String | --neutral-20 |
| lineSeriesColor | String | --neutral-50 | |
| loadingAnimationBackground | String | --neutral-10 | |
| loadingAnimationForeground | String | --neutral-90 | |
| majorGridLineBrush | sets the brush for the SciChart.Charting.Visuals.Axes.AxisBase Major Grid lines. Expects a System.Windows.Media.SolidColorBrush | String | --neutral-30 |
| minorGridLineBrush | sets the brush for the SciChart.Charting.Visuals.Axes.AxisBase Minor Grid lines. Expects a System.Windows.Media.SolidColorBrush | String | --neutral-20 |
| mountainAreaBrush | sets the default color for the mountain area brush | String | --neutral-90 |
| mountainLineColor | sets the default color for the mountain line color | String | --neutral-90 |
| overviewFillBrush | sets the fill brush for the overview property | String | --neutral-90 |
| planeBorderColor | sets a color of the axis plane border | String | --neutral-90 |
| rolloverLineBrush | sets the line brush for the rollover property | String | --neutral-90 |
| rubberBandFillBrush | sets the fill brush for the RubberBandXyZoomModifier drag reticule | String | --neutral-90 |
| rubberBandStrokeBrush | sets the stroke brush for the RubberBandXyZoomModifier drag reticule border | String | --neutral-90 |
| sciChartBackground | sets the background of the entire SciChart.Charting.Visuals.SciChartSurface | String | --neutral-10 |
| scrollbarBackgroundBrush | sets default brush for background of the scrollbar | String | --neutral-90 |
| scrollbarBorderBrush | sets default brush for border of the scrollbar | String | --neutral-90 |
| scrollbarGripsBackgroundBrush | sets default brush for backgrounds of the scrollbar grips | String | --neutral-90 |
| scrollbarViewportBackgroundBrush | sets the background brush (fill) for the SciChart.Charting.Visuals.SciChartScrollbar viewport area | String | --neutral-90 |
| scrollbarViewportBorderBrush | sets the border brush (fill) for the SciChart.Charting.Visuals.SciChartScrollbar viewport area border | String | --neutral-90 |
| shadowEffectColor | sets the shadow effect color | String | --neutral-90 |
| textAnnotationBackground | sets the default brush for the SciChart.Charting.Visuals.Annotations.TextAnnotation background | String | --neutral-10 |
| textAnnotationForeground | sets the default brush for the SciChart.Charting.Visuals.Annotations.TextAnnotation text foreground | String | --neutral-90 |
| tickTextBrush | sets the tick text brush applied to text labels | String | --neutral-90 |
| upBandSeriesFillColor | sets the default color for the up band fill color | String | --neutral-90 |
| upBandSeriesLineColor | sets the default color for the SciChart.Charting.Visuals.RenderableSeries.BaseRenderableSeries.Stroke, which defines the up band line color | String | --neutral-90 |
| upBodyBrush | sets the Brush used for candle body on up-candles (close > open). If null, UpBodyColor property is used. | String | --neutral-90 |
| upWickColor | sets the Color used for wicks and outlines on up-candles (close > open). | String | --neutral-90 |
defaultColorMapBrush
| Name | Description | Property Type | Default |
| 0.offset | The offset for ColorMapPoint 0 | Double | 0 |
| 0.color | The color for ColorMapPoint 0 | String | --neutral-10 |
|
1.offset |
The offset for ColorMapPoint 1 | Double | 0.5 |
| 1.color | The color for ColorMapPoint 1 | String | --neutral-20 |
| 2.offset | The offset for ColorMapPoint 2 | Double | 1 |
| 2.color | The color for ColorMapPoint 2 | String | --neutral-30 |
Neutrals color theme
| Variable | Hex |
|
--neutral-10 |
#FAFAFA |
| --neutral-20 | #F4F4F4 |
|
--neutral-30 |
#D8D8D8 |
| --neutral-40 | #BDBDBD |
| --neutral-50 | #A1A1A1 |
| --neutral-60 | #767676 |
| --neutral-70 | #5E5E5E |
| --neutral-80 | #515151 |
| --neutral-90 | #323232 |
| --neutral-100 | #161616 |