Interaction Properties
The interaction properties configure how a user interacts with the chart, including its menu and interaction modes. They are summarized here and described in further detail in the linked sections below.
| Name | Description | Property Type |
|---|---|---|
| mode | Specifies which interaction mode is active. Only one mode may be selected at a time because they produce different results when a user clicks on the chart. The mode can be selected form the menu or set directly in the component props. | Mode |
|
menu |
Configures the general appearance of the chart menu that includes buttons to set the interaction mode, download a PNG of the chart, reset the zoom level, and clear annotations, range brushes, or measurements.
The visibility of most buttons in the menu is set in the properties specific to that button, not in this Menu object. |
Menu |
|
resetZoom |
Allows the user to reset the axis ranges based on the the axis range properties. | ResetZoom |
| playPause |
Allows the user to pause or resume data updates in the chart. Data for configured pens is rendered as it is added to the props. Pausing data updates can be done for analysis or to create a screenshot without having new data change the appearance of the chart.
It may be more efficient to stop data bindings from executing than to use this button. |
PlayPause |
| export | Allows the user to download a PNG format copy of the chart. This includes everything visible on the chart and can be sized and printed as desired. | Export |
| rangeBrush | Object to configure the range brush mode. | RangeBrush |
| xTrace | Object to configure the x trace mode. | XTrace |
| measurement | Object to configure the measure mode. | Measurement |
| zoomToArea | Object to configure the zoom to area mode. | Zoom to Area |
| panAndZoom | Object to configure the pan and zoom mode. | Pan and Zoom |
| mouseWheelZoom |
Object to configure mouse wheel zooming over the chart or individual axes.
This is not included in a mode because the modes do not make use of the mouse wheel so their use does not conflict. |
Mouse Wheel Zoom |
| overview | Object to configure the chart overview that provides a view of all pens on one x and y axis pair and allows panning and zooming to a specific x range. | Overview |
| annotation | Object to configure the annotate mode. |
Mode
| Name | Description | Property Type |
|---|---|---|
| None | No interactions are active. Clicking on the chart will not change anything. | String |
| PanZoom | Enables click-and-drag panning as well as pinch-zooming on touch screens. | String |
| Measure | Enables drawing lines which can be used to calculate slope, length, or differences in the x or y direction. | String |
| XTrace | Displays pen and mouse coordinate information when hovering over the chart and enables the placement of markers along the x axis that display the y values of visible pens. | String |
| RangeBrush | Enables the selection of x ranges on the chart which can be used to display statistics for the data in that range. | String |
| Annotate | Enables adding custom text annotations to the chart. | String |
| ZoomToArea | Enables the selection of a rectangular area to zoom in to. | String |
Menu
| Name | Description | Property Type |
|---|---|---|
| visible | Toggles visibility of the menu. | Boolean |
|
selectedColorBg
|
Color of the background of the active interaction mode button. | Color |
|
selectedColorFg
|
Color of the icon on the active interaction mode button. | Color |
ResetZoom
| Name | Description | Property Type |
|---|---|---|
| visible | Toggles visibility of the reset zoom button in the menu. | Boolean |
| triggerReset | Boolean |
PlayPause
| Name | Description | Property Type |
|---|---|---|
| visible | Toggles the visibility of the play/pause button in the menu. | Boolean |
Export
| Name | Description | Property Type |
|---|---|---|
| visible | Toggles the visibility of the download as PNG button in the menu. | Boolean |
| triggerExport | Triggers the |
RangeBrush
| Name | Description | Property Type |
|---|---|---|
| visible | Toggles the visibility of the range brush mode button in the menu. | Boolean |
| maxInstances | The maximum number of concurrent ranges. When this number is exceeded, the oldest ranges are deleted first. | Integer |
| brush | Object containing properties for the appearance of ranges. | Brush |
| ranges | An array of 2-element arrays containing x values representing each range. | Range[] |
Brush
| Name | Description | Property Type |
|---|---|---|
| fill | The color of the interior of ranges. | Color |
| stroke | The color of the stroke (outline) of ranges. | Color |
| thickness | The thickness of the outline of ranges. | Integer |
| opacity | The opacity of ranges (1: opaque, 0: invisible). | Float |
Ranges
Range properties are stored on a per-axis basis as an array of property objects.
| Name | Description | Property Type |
|---|---|---|
| xAxis | The x axis that this range is located on. | String |
| start | The x coordinate of the leftmost side of the range. | Integer |
| end | The x coordinate of the rightmost side of the range. | Integer |
XTrace
Object containing properties for the xTrace mode.
| Name | Description | Property Type |
|---|---|---|
| visible | Toggles the visibility of the xTrace mode button in the menu. | Boolean |
| showToolTip | Toggles the visibility of the tooltip that follows the cursor. | Boolean |
| showAxisLabels | Toggles the visibility of the coordinate labels following the cursor along the axis. | Boolean |
| showXLine | Toggles the visibility of the vertical line showing the x coordinate of the mouse. | Boolean |
| showYLine | Toggles the visibility of the horizontal line showing the y coordinates of the mouse. | Boolean |
| maxInstances | The maximum number of x-traces allowed on the chart. When this number is exceeded, the oldest traces are removed first. | Integer |
| trace | Object containing properties for the appearance of all xTrace functionality. | Trace |
Trace
| Name | Description | Property Type |
|---|---|---|
| stroke | The color of the outline of the lines representing the coordinates of the mouse, as well as the text within the tooltip and within the axes labels. | Color |
| thickness | The thickness of the lines representing the coordinates of the mouse. | Integer |
| lineDash | An array holding numeric values representing line dashing. Add an even amount of numbers to the array to create a repeating pattern. | Array |
| fill | The color of the fill of the lines representing the coordinates of the mouse. | Color |
| font | The font for all text present in xTrace mode. | Font |
| fontSize | The size of all text present in xTrace mode. | Float |
Measurement
Object containing properties for the slope mode.
| Name | Description | Property Type |
|---|---|---|
| visible | Toggles the visibility of the slope mode button in the menu. | Boolean |
| maxInstances | The maximum number of concurrent lines allowed. When this number is exceeded, the oldest lines will be removed first. | Integer |
| line | Object containing properties for the appearance of all slope mode lines. | Line |
| label | Object containing properties for the appearance of all slope mode line labels. | Label |
| axisHighlight | Object containing properties for the appearance of highlights applied to each axis when selected. | AxisHighlight |
Line
| Name | Description | Property Type |
|---|---|---|
| stroke | The color of the outline of slope mode lines. | Color |
| thickness | The thickness of slope mode lines. | Integer |
| lineDash | An array holding numeric values representing line dashing. Enter an even amount of numbers to create a recurring pattern. | Array |
| opacity | The opacity of slope mode lines (1: opaque, 0: invisible). | Integer |
Label
| Name | Description | Property Type |
|---|---|---|
| stroke | The color of the outline of the line label. | Color |
| fill | The color of the interior of the line label. | Color |
| fontFamily | The font family of the text in the line label. | String |
| fontSize | The size of the text in the line label. | Float |
AxisHighlight
| Name | Description | Property Type |
|---|---|---|
| fill | The color of the axis highlight interior. | Color |
| stroke | The color of the axis highlight outline. | Color |
| thickness | The thickness of axis highlight outline. | Integer |
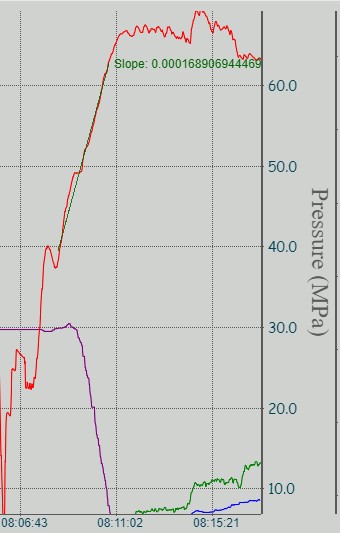
Finding the slope between 2 points on the chart is easy using the slope mode.
ZoomToArea
Object containing properties for the zoomToArea mode.
| Name | Description | Property Type |
|---|---|---|
| visible | Toggles the visibility of the zoomToArea mode button in the menu. | Boolean |
| animated | Toggles whether the zoom includes a gradual animation or immediately snaps to the area. | Boolean |
PanAndZoom
Object containing properties for mouse/touch panning and pinch-zooming.
| Name | Description | Property Type |
|---|---|---|
| visible | Toggles the visibility for the zoomPan mode button in the menu. | Boolean |
| pinchZoom | Object containing properties for pinch-zooming. | PinchZoom |
| zoomPan | Object containing properties for panning. | ZoomPan |
| xAxisDrag | Object containing properties for dragging on x axes. | xAxisDrag |
| yAxisDrag | Object containing properties for dragging on y axes. | yAxisDrag |
| zoomExtents | Object containing properties | Object |
| enabled | Determines whether zoom extents are enabled | Boolean |
xAxisDrag
| Name | Description | Property Type |
|---|---|---|
| enabled | Toggles dragging functionality on all x axes. If this is enabled, the user may drag on the x axes to select a range to zoom in on horizontally. | Boolean |
yAxisDrag
| Name | Description | Property Type |
|---|---|---|
| enabled | Toggles dragging functionality on all y axes. If this is enabled, the user may drag on the y axes to select a range to zoom in on vertically. | Boolean |
ZoomPan
| Name | Description | Property Type |
|---|---|---|
| enabled | Toggles panning functionality | Boolean |
| axes | Object containing all axes with zoomPan functionality enabled. | Axes |
| executeOn | The input that triggers panning | Enum (add ref) |
| xyDirection | Object containing properties that allow panning and zooming to be limited by the x or y axes. | xyDirection |
⮱ZoomPan.PinchZoom
| Name | Description | Property Type | Default |
|---|---|---|---|
| enabled | Toggles pinch-zooming functionality. | Boolean | true |
| horizontalGrowthFactor | Affects the horizontal pinch-zooming rate. | Float | 1 |
| verticalGrowthFactor | Affects the vertical pinch-zooming rate. | Float | 1 |
⮱ZoomPan.axes
If the axes prop is left empty, Ignition will behave as though it contains all axes, and chart panning will be fully enabled.
| Name | Description | Property Type |
|---|---|---|
| x | All x axes on which chart panning is enabled. | Array |
| y | All y axes on which chart panning is enabled. | Array |
ZoomPan.xyDirection
| Name | Description | Property Type |
|---|---|---|
| xDirection | Allows chart panning only on x axes. | String |
| yDirection | Allows chart panning only on y axes. | String |
| xyDirection | Allows free chart panning on both x and y axes. | String |
MouseWheelZoom
Object containing properties for mouse wheel zooming.
| Name | Description | Property Type | Default |
|---|---|---|---|
| enabled | Specifies whether mouse wheel zooming is enabled. | Boolean | true |
| growFactor | The rate of mouse wheel zooming (Should be set to a small number). | Float | 0.001 |
| axes | Object containing all axes with mouse wheel zooming functionality enabled. | Axes | {} |
Axes
| Name | Description | Property Type |
|---|---|---|
| x | All x axes with mouse wheel zooming enabled. | Array |
| y | All y axes with mouse wheel zooming enabled. | Array |
Overview
| Name | Description | Property Type |
|---|---|---|
| overview | Object containing basic properties | Object |
| visible | Determines visibility | Boolean |
| height | ??? | Integer |
| axes | ??? | Object |
| x | Array | |
| y | Array |
Annotation
| Name | Description | Property Type |
|---|---|---|
| annotation | Sets the annotation properties | Object |